An address map is a valuable way of representing points of data. We’ve been asked to create membership maps for organizations. A request by a church to make a map showing church member addresses inspired us to write up this method of making an address map.
Google Map’s Your Places is an easy and free portal to seeing your spreadsheet data in an online map. While there are more involved ways of accomplishing this, including linking an online version of your spreadsheet data “live” to Google Maps, let’s explore the simplest way of mapping your Excel data.
(Note that some of the menus and names of interface features change when Google decides to update this service.)
Google Account & Microsoft Excel
To start, you’ll need a Google account. You can create one at Google. For a user name either create a Gmail address or just use an existing, non-Google email address.
The other pre-requisite you’ll need is a Microsoft Excel spreadsheet with location data. For this blog post, I employed a spreadsheet of parishioners provided by a church office that has columns for name, street address, city, state, and zipcode.
Google’s Your Places
Once your account is set up and your spreadsheet populated with data, you’re ready to begin. Go to Google Maps and click the three-line “hamburger menu” icon in the upper-left.

This opens the Google Maps menu with different options. You’re interested in Your Places.
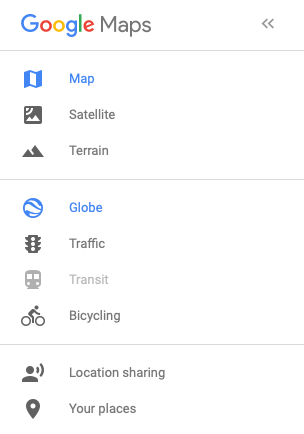
Now click Your Places mid-way down the menu.

Create Your Map
Next, click CREATE MAP at the bottom of the menu. This brings up the new map box in which you’ll edit information about the map and import data into one of its layers.In the new map box, click on Untitled map and give the map a suitable name in the pop-up Edit map title and description box.

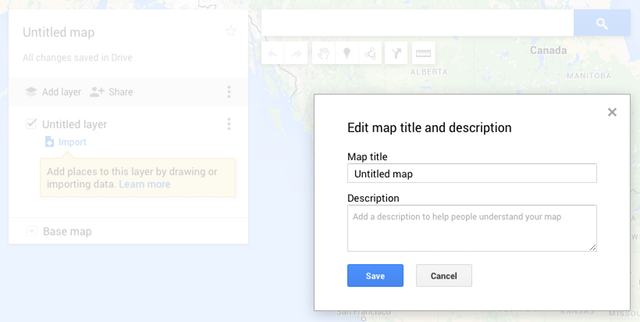
Next, click on “Import” in the new map box and then in the pop-up import box, drag and drop the icon of your spreadsheet. This initiates Google’s processing of your data.
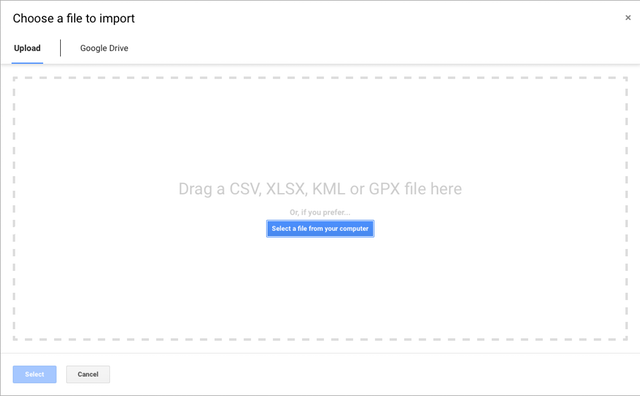
Drag your Excel file, or other file type, to the import box.
Connecting Excel Columns To Google Placemarks
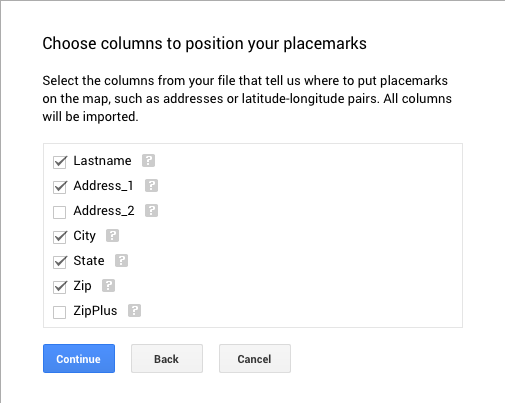
When the import completes, Google opens the Choose columns to position your placemarks box. Checkmark the boxes (e.g., name, address, city, state, zip) that are relevant for your data and then click Continue.
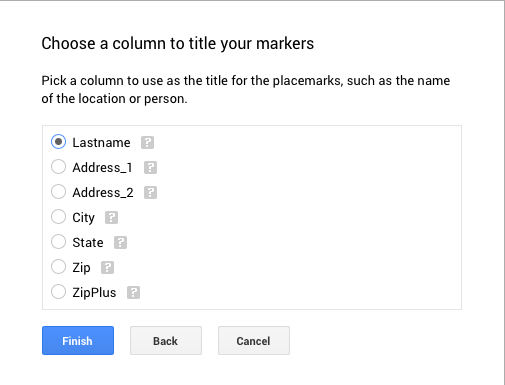
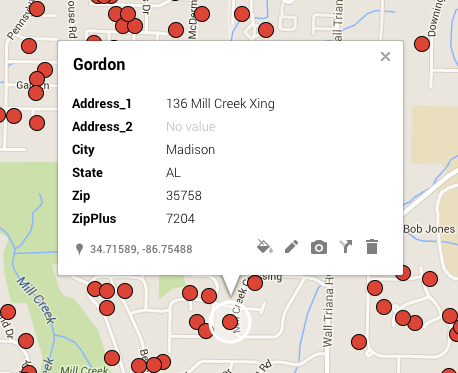
Now, in the Choose a column to title your markersbox, checkmark the appropriate box (for example, Lastname). The column you choose provides the title to the call-out information box that pops up when you click a marker on the map. Click Finish and Google completes importing your data.
Editing Icons
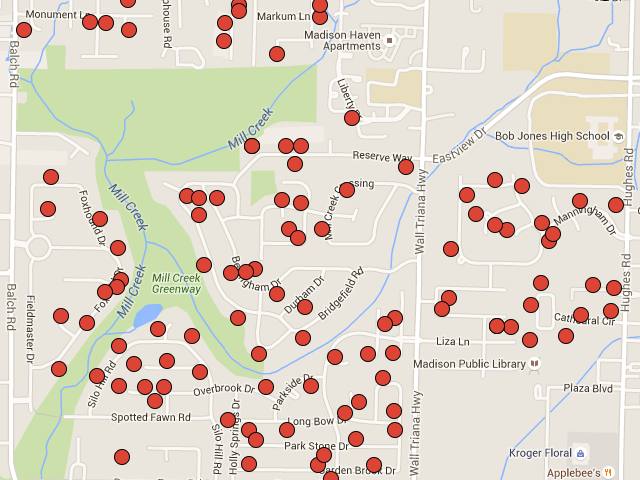
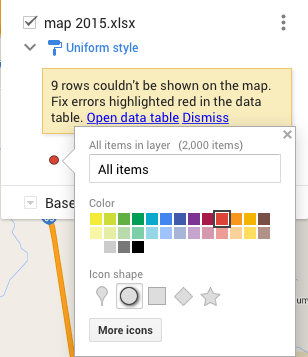
The resulting map should look familiar: Google’s iconic balloon icons saturate the map, each icon representing a row of your spreadsheet. If you want to change the icon, Google gives you some options. To access these, hover your mouse cursor over All itemsand click the paint bucket icon at the right end of the field. For my map, I changed the default balloon icon for a red dot.
A Couple Problems
That was easy. Easy, that is, unless your spreadsheet has location errors or it just plain confuses Google’s addressing software. You may see a warning in the new map box about rows with errors that Google is unable to display on the map. To correct, click Open data tableand either edit the offending data or delete the rows (if you can live without their data). Also, zoom out on the map and see if there are odd markers located where they shouldn’t be. For these, right-click on each marker and choose Delete.
Another data problem you may confront is that not all of your data was imported. As of this writing, Google Maps imports a maximum of 2000 addresses. This may require you to break your spreadsheet into two files and import both.
You can add more markers to your map by creating a new layer and entering an address (or, sometimes, the name of a point-of-interest) in the Search box to the right of the new map box. You can add your Google Map to your website by creating an iframe on the web page that links to the URL of your new Google Map.
For more information on Google Map’s Help page or try Reddit.